

My previous article in the Diplomatic Pouch explored the beginning of a Diplomacy game. Using statistical analysis, I answered the following questions: What supply centers is each Power likely to capture in 1901 and 1902? and How well does each Power do, in the long term, if it captures a given supply center?
That's all well and good for 1901 and 1902. But what about 1903? What about further on down the road, when the game is winding down and someone is hoping to pull off a victory? Can statistical analysis tell us what tends to happen at the end of a Diplomacy game? Of course it can.
As a Diplomacy player, your ultimate objective is winning the game, which (in the Standard variant) means gaining control of 18 supply centers. From the very beginning of the game, you should be thinking about how to achieve this objective. What will your 18 centers be? How long will it take you to get to them? Which of your six competitors are going to help you out, and which ones are you going to bump off?
The answers to these questions depend heavily on who your opponents are and how your rapport with them develops. Do not hurry to formulate your plan before getting to know the other players. On the other hand, you cannot escape a certain element of geographical fate. If you're England, you'll likely need to count the German home centers among your 18; and as a consequence you may have to eliminate Germany, even if you get along great with the German player. But you probably won't need the Italian home centers (although you may need to attack Italy in order to take other centers from him), and you almost certainly won't need the Turkish centers. So go ahead and negotiate an alliance with the Kaiser; just keep in mind that your chances of victory are low unless you mercilessly backstab him and destroy him utterly. But he doesn't have to know that.
In this article, I will present data from FRIGATE, my trusty statistical-analysis tool. I will answer the following four solo-victory-related questions:
| Number of Games | Games ending in a solo victory for... | ||||||||||||||||||||||||||||||||||||||||||||||||
|---|---|---|---|---|---|---|---|---|---|---|---|---|---|---|---|---|---|---|---|---|---|---|---|---|---|---|---|---|---|---|---|---|---|---|---|---|---|---|---|---|---|---|---|---|---|---|---|---|---|
| Anyone | Austria | England | France | Germany | Italy | Russia | Turkey
| All Press Types
| (52.1%) (5.9%) (7.0%) (10.3%) (8.0%) (5.1%) (7.5%) (8.3%) Press Type
| None
| (58.8%) (6.0%) (7.3%) (13.0%) (9.7%) (5.6%) (7.0%) (10.1%) Incomplete
| (46.7%) (4.6%) (6.2%) (11.0%) (7.5%) (5.0%) (5.0%) (7.4%) Full
| (46.7%) (6.0%) (6.8%) (7.7%) (6.5%) (4.6%) (8.3%) (6.8%) | |||||||||||||||||||||||||||||||||||||
These results parallel the findings in my first article. No-press games are more likely to end in solo victories than games with press. France is by far the most likely victor, although Russia earns the most solos in full-press games. Italy and Austria are the hardest Powers to win with, regardless of press type. Russia wins more often in games with more press, while France, Germany, and Turkey benefit from less press.
| All Games | Games ending in a solo victory for... | ||||||||||||||||||||||||||||||||||||||||||||||||
|---|---|---|---|---|---|---|---|---|---|---|---|---|---|---|---|---|---|---|---|---|---|---|---|---|---|---|---|---|---|---|---|---|---|---|---|---|---|---|---|---|---|---|---|---|---|---|---|---|---|
| Anyone | Austria | England | France | Germany | Italy | Russia | Turkey
| All Press Types
| 13
| 12
| 12
| 13
| 12
| 12
| 13
| 11
| 12
| Press Type
| None
| 14
| 14
| 13
| 15
| 13
| 14
| 13
| 12
| 14
| Incomplete
| 12
| 12.5
| 13
| 13
| 12
| 12
| 13
| 11
| 12
| Full
| 11
| 11
| 11
| 12
| 11
| 11
| 11
| 10
| 11
| | |
Note that these averages are actually medians, rather than means. This reduces the effect of outliers (i.e. the occasional game that continues until 1952, which distorts the mean.) It also ensures that the data is almost always in the easy-to-digest form of whole numbers.
The game-length numbers here depend on two variables: press type and game outcome. Table 2 shows that more press tends to make a game go more quickly, which makes perfect sense: it's easier for players to cooperate in a press game. Without press, you can agree to ally with your neighbor but still be unable to coordinate your units, because you have to guess how your ally is going to move. As a result, your own moves will inevitably involve guesswork, resulting in a lot of bouncing and other unproductive movement.
Games ending in solos are likely to wrap up at about the same time as games ending in draws. This is surprising; one would think that solo games end sooner. After all, a drawn game is often the result of a failed attempt at a solo, and these games may continue for many game-years after a draw becomes inevitable, because the player trying to solo won't give up. These data suggest a counterbalancing factor: some games are declared draws well before the draw is inevitable. Perhaps some of us are giving up on our solo chances a little bit too soon, or accepting a large draw when we could fight for a smaller one.
Lastly, some Powers take longer to get to 18 than others. The Russian steamroller is notably fast; Russian solo victories take place one or two years before everyone else's. The English are a year slower than the others, perhaps because of the necessity of setting up convoys onto mainland Europe. The other five Powers are virtually equal in speed.
A picture is worth a thousand numbers. The most effective way to show the raw data for this question is not with another huge chart, but with colorful maps. Here are some maps showing the centers typically owned by each Power when it achieves a solo victory.
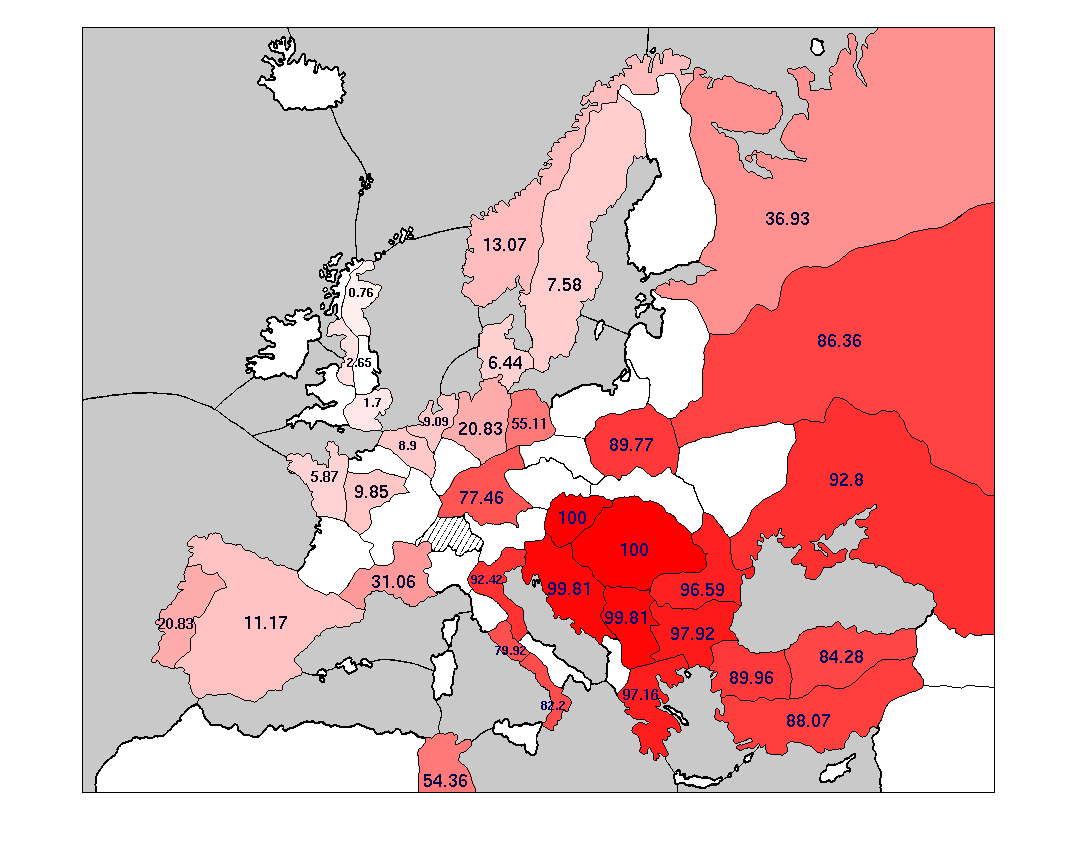
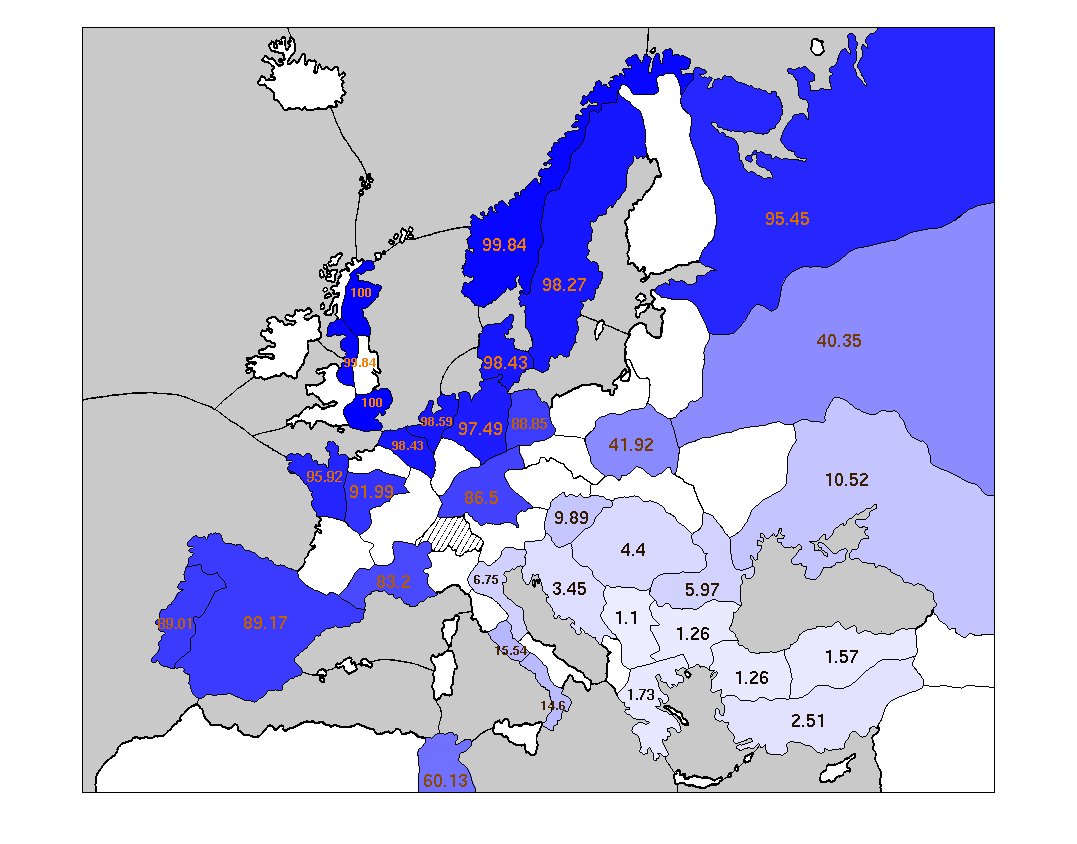
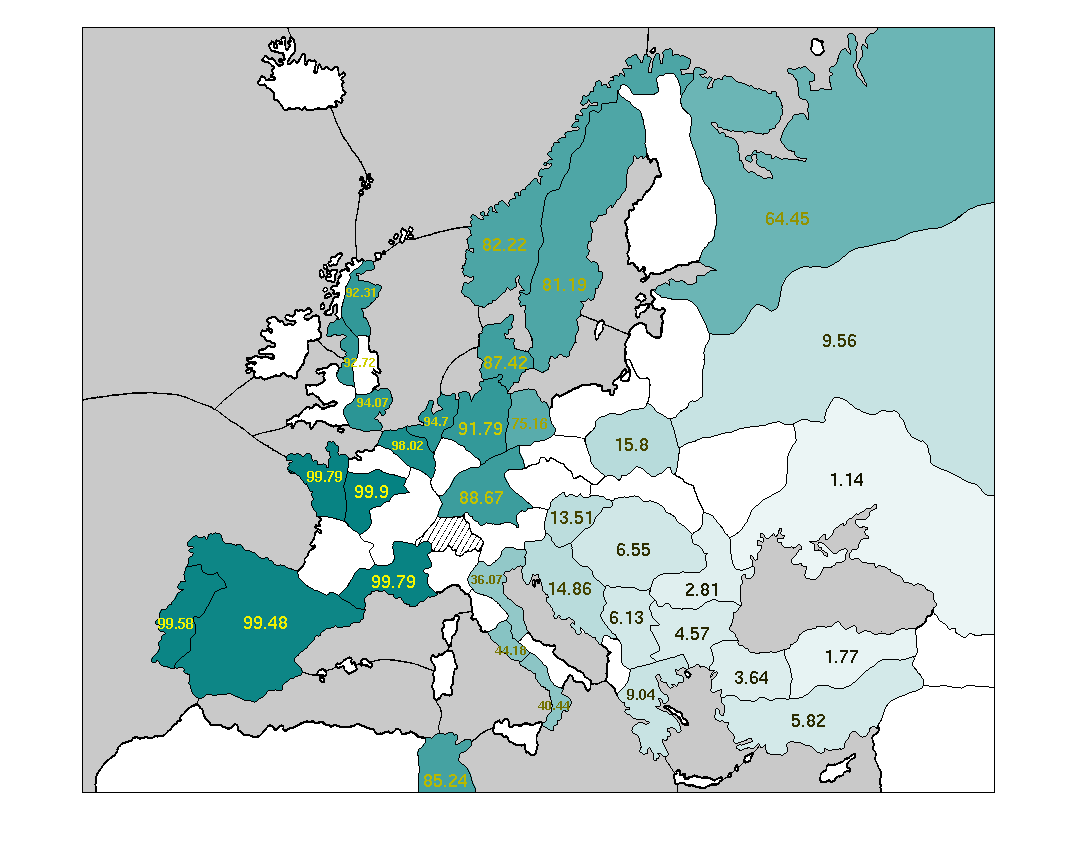
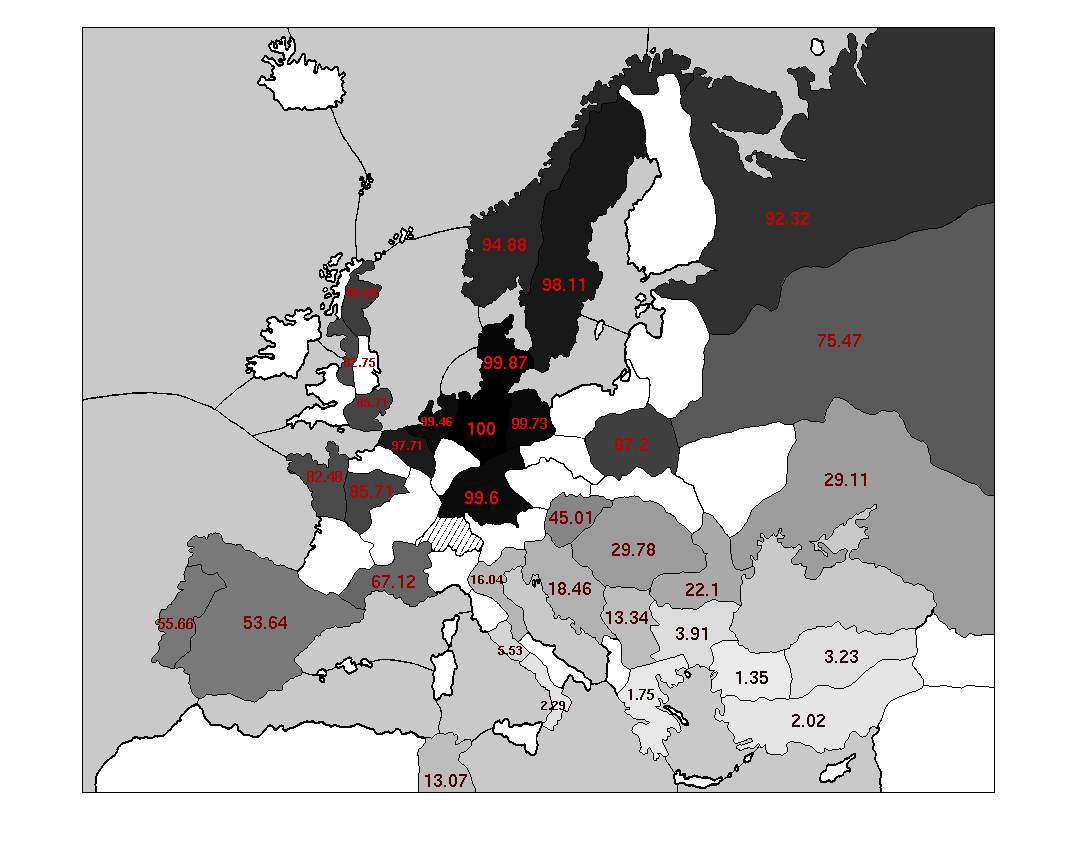
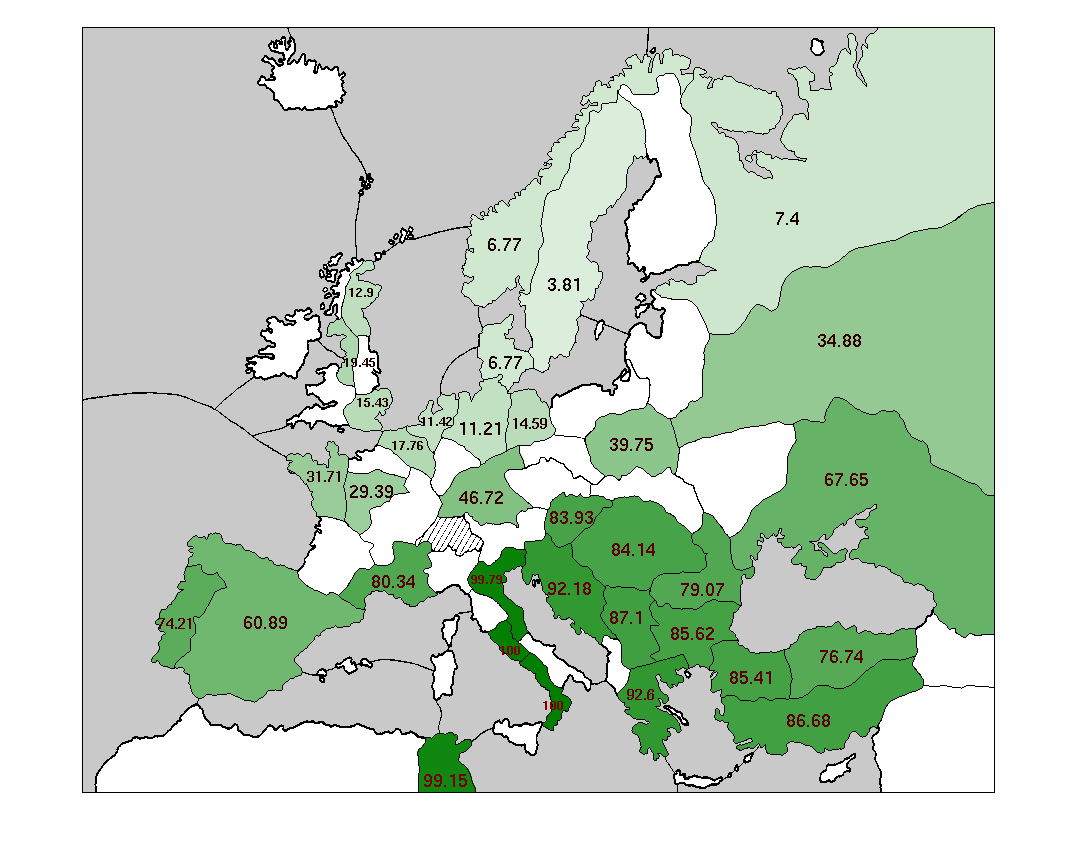

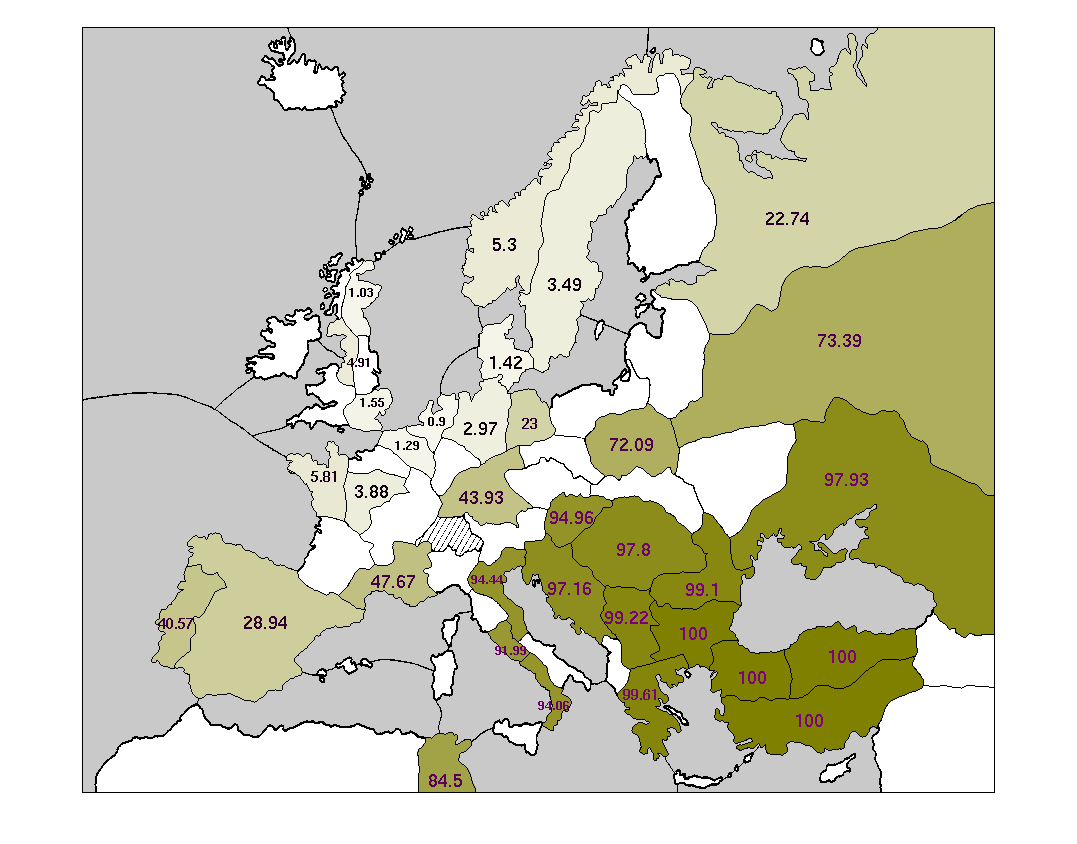
Some words about the coloration of these maps: every supply center is colored with an intensity matching the probability of that Power occupying the center in its victory year. The probability is also written on to each supply center, expressed as a percentage.
These maps suggest that, in solo victories, anything is possible. Every single Power owns every single center at least sometimes. On the other hand, some positions are much more likely than others. Specifically: most solo victories are heavily concentrated on one side of the main stalemate line.
As an experienced Diplomacy player will know, the main stalemate line (hereafter abbreviated MSL) separates a set of 17 northern and western supply centers from a distinct set of 17 southern and eastern centers. The northern centers include the English, French, and German home centers; the Iberian, Lowland, and Scandinavian neutrals; and St. Petersburg. The seven Great Powers include three exclusively northern Powers (England, France, Germany) and three exclusively southern Powers (Italy, Austria, Turkey). Russia is often lumped in with the southern Powers, although it is more ambiguous than anyone else on the board, since it owns home supply centers on both sides of the line. The primary feature of the MSL is that supply centers on one side of it are easily defended, by means of a stalemate line, from attacks originating on the other side. Conversely, it is hard to break across the MSL and capture centers on the far side of it.
The power of the MSL is borne out in these maps. Every side-bound Power (i.e., not Russia) occupies the centers on its own side of the MSL much more frequently than the centers on the far side. The "Wicked Witches", England and Turkey, are far away from the MSL and are particularly susceptible: each is significantly more likely to occupy any center on its own side of the MSL than any center on the far side. These differentials are not purely the result of increased distance to the far-side centers: note that France is almost twice as likely to take St. Petersburg (four turns away at best from any French home center) as Venice (two turns away from Marseilles.)
Of course, you cannot win by adhering completely to one side of the MSL, since each side has only 17 centers. To win, you have to break across the MSL and grab at least one center on the other side. But what center is that likely to be? The answer is different for each Power, and it relates closely to the Powers' typical army/fleet makeup.
| All Games | Assuming the survival of... | ||||||||||||||||||||||||||||||||||||||||||||||||||||||||||||||||||||||
|---|---|---|---|---|---|---|---|---|---|---|---|---|---|---|---|---|---|---|---|---|---|---|---|---|---|---|---|---|---|---|---|---|---|---|---|---|---|---|---|---|---|---|---|---|---|---|---|---|---|---|---|---|---|---|---|---|---|---|---|---|---|---|---|---|---|---|---|---|---|---|---|
| Austria | England | France | Germany | Italy | Russia | Turkey
| This is the | probability of a solo for... Austria
| 5.9%
|
| 9.5%
| 6.6%
| 8.3%
| 6.6%
| 4.1%
| 1.1%
| England
| 7.0%
| 11.0%
|
| 3.3%
| 3.0%
| 7.6%
| 6.8%
| 10.1%
| France
| 10.3%
| 13.6%
| 3.2%
|
| 5.6%
| 13.2%
| 16.7%
| 15.4%
| Germany
| 8.0%
| 10.8%
| 3.3%
| 6.6%
|
| 11.9%
| 6.1%
| 12.6%
| Italy
| 5.1%
| 3.2%
| 6.1%
| 5.8%
| 7.7%
|
| 7.3%
| 1.7%
| Russia
| 7.5%
| 4.4%
| 8.1%
| 10.9%
| 7.2%
| 11.8%
|
| 6.2%
| Turkey
| 8.3%
| 1.9%
| 13.3%
| 11.1%
| 11.7%
| 3.7%
| 9.1%
|
|
| |
These numbers are a little tricky to interpret. Each Power has some generalized probability of winning, which is an average within the dataset of all games. Each Power's probability of winning changes when the dataset is restricted to games in which a particular other Power survives. (Note that "survival" is not the same thing as "not losing". You can lose without being eliminated if another Power achieves a solo, or if you get shut out of a No DIAS draw.)
For example, Germany solos in 8.0% of all games. Among games in which Turkey survives, however, Germany solos 12.6% of the time. This is strong evidence of a spoiler effect: Germany and Turkey have some common neighbors, so if Turkey is eliminated, some of Germany's neighbors get stronger and are more able to keep him at bay. A feisty Turkey, though, can distract other Powers, who then become unable to prevent a German solo. Germany actually has an incentive to ensure Turkey's continued survival through diplomatic means.
This chart of raw data is not a succinct way to answer our questions. If you're playing Italy, and you're trying to decide whether to take down Austria, you want to know if an Austrian bloodbath improves your chances. How much more likely is Italy to solo if Austria is eliminated? For that matter, Austria might be a threat to you, and you want to know if he's got designs on you: How much more likely is Austria to solo when Italy is eliminated? Let's define a statistical value, the mutual antagonism, as follows: two nations have a mutual antagonism equal to the amount that survival by one Power decreases the probability of a solo by the other Power. The number is averaged over both Powers, and normalized by their total probability of winning. For example, Austria and Italy have a mutual antagonism of
[ (5.9% - 6.6%) + (5.1% - 3.2%) ] / (5.9% + 5.1%) = 11.3%
| England | France | Germany | Italy | Russia | Turkey | ||||||||||||||||||||||||||||||||||||
|---|---|---|---|---|---|---|---|---|---|---|---|---|---|---|---|---|---|---|---|---|---|---|---|---|---|---|---|---|---|---|---|---|---|---|---|---|---|---|---|---|---|
| Austria | -59.1% | -24.6% | -36.8% | 11.3% | 36.5% | 79.4%
| England
|
| 62.0%
| 58.2%
| -13.8%
| -2.4%
| -52.6%
| France
|
|
| 33.2%
| -24.4%
| -55.6%
| -42.8%
| Germany
|
|
|
| -50.3%
| 14.5%
| -48.8%
| Italy
|
|
|
|
| -52.1%
| 59.6%
| Russia
|
|
|
|
|
| 4.1%
| |

Informally, you may think of this number as the amount by which you increase your chances to solo, if you are solely responsible for the elimination of another Power. Note that mutual antagonism may be negative, as in the case of Germany and Turkey, where each Power's survival increases the other's solo chances. Also note that this antagonism is purely a measure of the two Powers' likelihood of winning the game without eliminating each other. It is NOT the same thing as the Powers' inability to cooperate during the game, and it says nothing about the likelihood of them sharing in a draw.
Under this definition of mutual antagonism, the Austria/Italy relationship is not nearly as unfriendly as one might expect. It is lopsided: Italy is more likely to win by eliminating Austria than the other way around. But Austria should be more concerned with Russia than with Italy, and both Austria and Italy have much less to fear from each other than from Turkey.
The strongest antagonisms involve Powers on the same side of the MSL, and in particular the Wicked Witches, England and Turkey. England vis-a-vis France and Germany, and Turkey vis-a-vis Italy and Austria, are by far the four most antagonistic relationships on the map. This makes sense: England and Turkey usually must control all 17 centers on their respective sides of the MSL in order to solo, which means they need to eliminate the other Powers that sit among those 17 centers.
On the other hand, the relations between Powers on opposite sides of the MSL are uniformly friendly. This is undoubtedly due to the spoiler effect already observed. The friendliest pair is England and Austria, perhaps because the English Navy and the Austrian Army are highly unlikely to step on each other's toes. The implication is that, in order to win, you do not need to eliminate Powers on the far side of the MSL. You may need to attack them — after all, you need to grab a center or two across the MSL — but elimination usually does not occur.
Russia, once again, is a special case. Russia can cooperate with the Wicked Witches, because they do not need to eliminate Russia completely in order to secure their side of the MSL. (Furthermore, Russia's victories bisect the MSL and therefore do not need to flush England or Turkey out of their home centers.) Russia's worst enemy is Austria, followed by Germany and Turkey. It seems that Russia's friendliness towards his neighbors is inversely proportional to their inclination to build armies.
Thanks to an ever-increasing dataset, I've gathered data relating to the end of a Diplomacy game, particularly games ending in solo victories. We see that the main stalemate line (MSL) heavily affects the circumstances of most solo victories. The three northern Powers — England, France, and Germany — usually include most of the 17 northwestern supply centers, and very few of the 17 southeastern centers, in their solos. If one of these Powers solos, the other two tend to be eliminated. The mirror image is true for the three southern Powers — Italy, Austria, and Turkey. The "Wicked Witches" (England and Turkey) are the most deeply ensconced on their sides of the MSL, and so they follow these trends most strongly. England and Turkey are very likely to take most or all of their side's 17 supply centers when they win, and they are very likely to eliminate their neighbors in the process.
Russia is the only Power not to fit these patterns. Russian solo victories almost always cross the MSL and include significant numbers of centers on both sides, although they tend to be concentrated in the south, where three of Russia's four home centers are. Not coincidentally, Russia also tends to achieve its solos a few game-years sooner than any of the other Powers.
Now that I've spoken authoritatively, let me remind you that there are no certainties in Diplomacy. Statistical probabilities are just that — probable. Turkey doesn't usually get far across the MSL, but he takes Liverpool in 5% of his solo victories, and Norway in another 5%. And while Russia tends to win a year or two more quickly than the other Powers, it's also true that one in four Russian solos takes multiple years longer than the overall median. Statistical analysis can tell you what is likely, and what is rare, but it can't tell you what is impossible.
This should underscore a larger point: do not treat these numbers as gospel truth. They describe each Power's typical route to 18 supply centers, but that does not mean you can search the charts for a secret code that will magically guarantee you 18 centers in your own game. Statistical analysis can teach you what your solo victory is (probably) going to look like, but it won't tell you how to get there. As always, if you want to win, you're going to have to brush up on your Diplomacy.
 |
Josh Burton ([email protected]) |
If you wish to e-mail feedback on this article to the author, and clicking on the envelope above does not work for you, feel free to use the "Dear DP..." mail interface.